
Advanced analytics
Advanced analytics
Advanced Analytics gives you a deeper understanding of how your content, audience, and revenue perform across the platform.
Instead of showing only overall account statistics, it helps you analyze individual content, compare performance, identify trends, and discover opportunities to grow your audience and earnings.
The Analytics module is organized into six dedicated sections:
- Overview
- Content
- Audience
- Revenue
- Growth
- Insights
Content
The Content section helps you understand how each type of content performs, so you can see what resonates most with your audience.
Compare performance across posts, courses, livestreams, groups, and subfeeds, identify your best-performing content, and discover opportunities to increase engagement, conversions, and revenue.
Content Overview
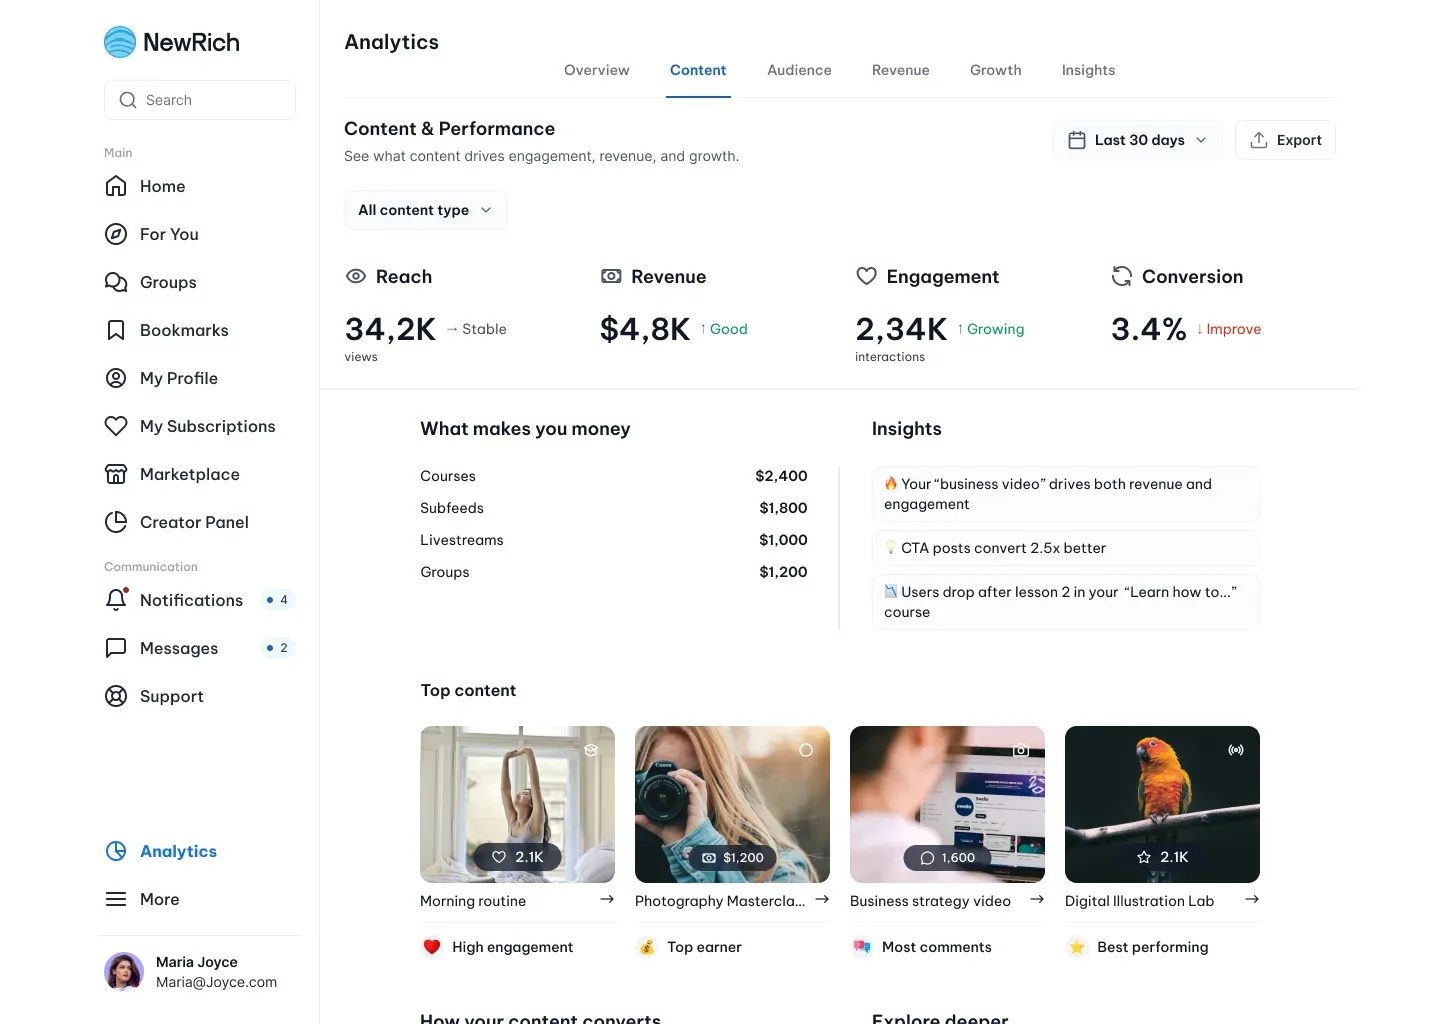
The Content Overview dashboard provides a complete snapshot of your published content in one place.
From here you can compare different content types, filter results by category or date range, identify your top-performing content, and export analytics reports when needed.
The dashboard also highlights key performance metrics—including Reach, Engagement, Revenue, and Conversion—along with AI-powered insights that help you quickly understand what's performing well and where improvements can be made.
Individual Content Analytics
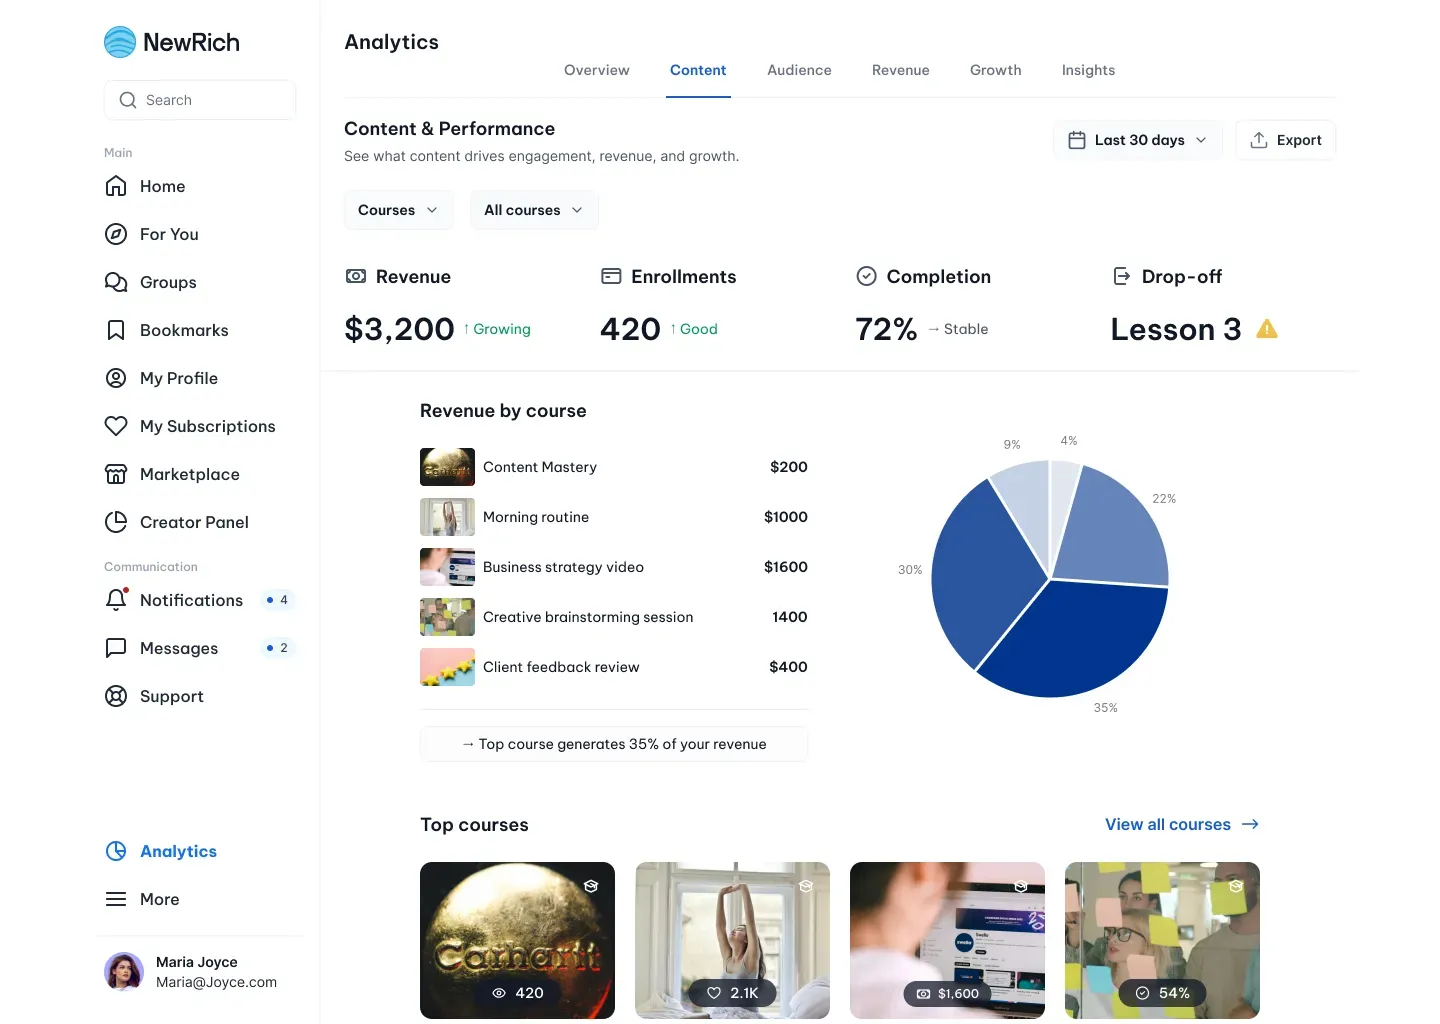
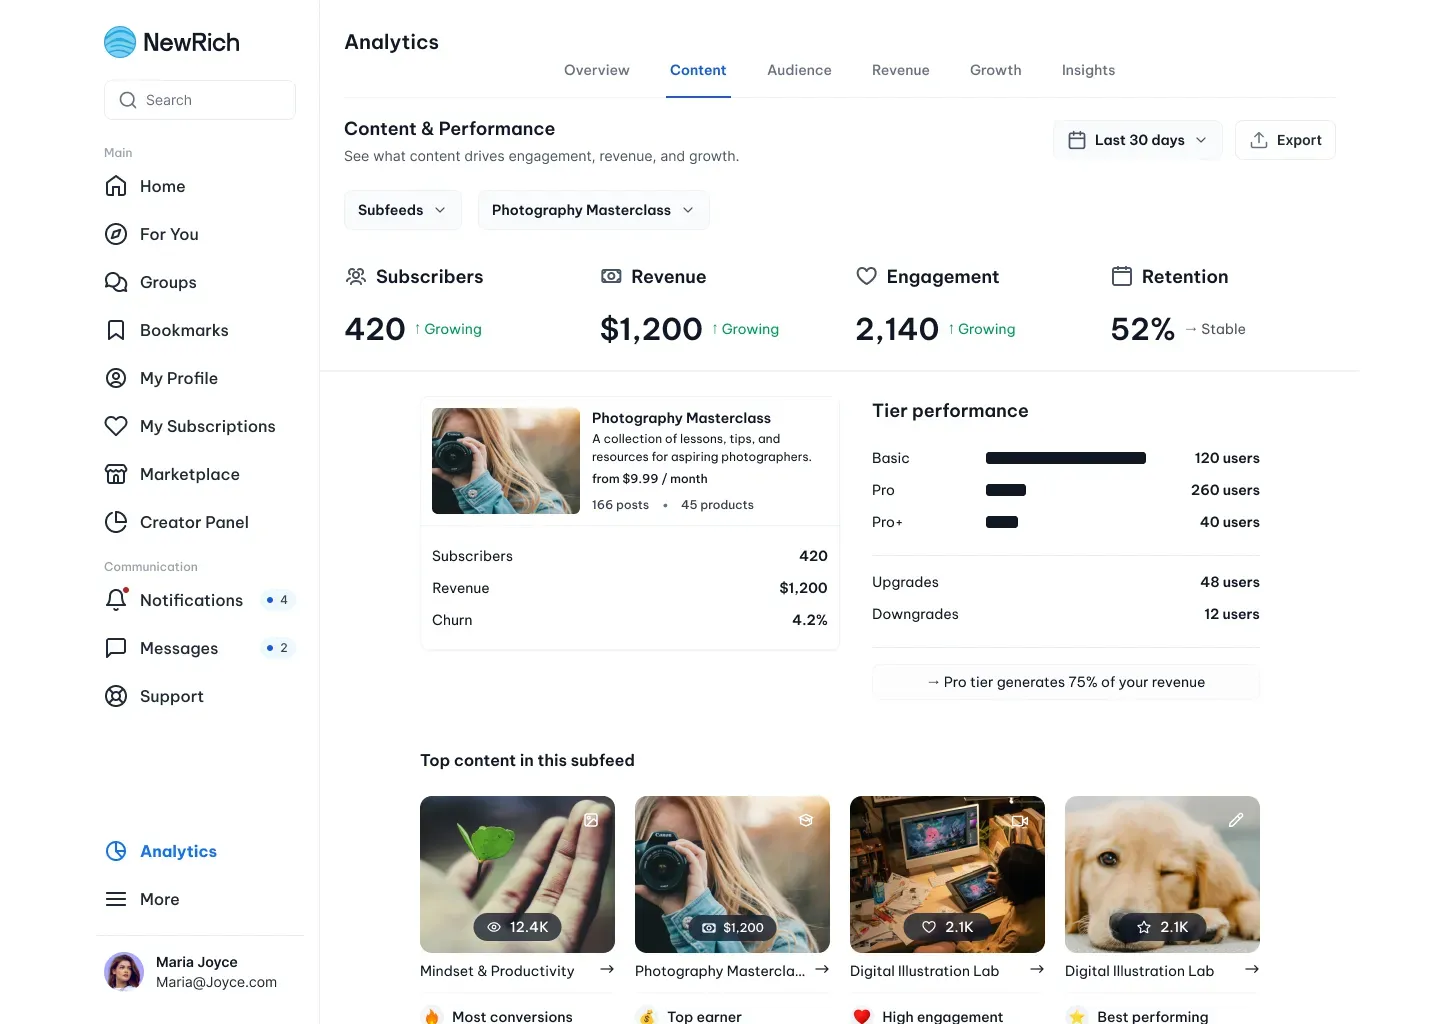
Every supported content type has its own dedicated analytics dashboard with metrics tailored specifically to that format.
Whether you're analyzing a course, subfeed, post, livestream, or group, each dashboard focuses on the KPIs that matter most while providing a consistent analytics experience across the platform.
Content Lists
Each content category includes a searchable list that makes it easy to browse, filter, and compare your content.
Open any item directly from the list to explore detailed performance insights, with available columns automatically adapting to the selected content type.
Content Details
Selecting a piece of content opens a dedicated analytics page with metrics specific to that content.
Depending on the content type, you can review engagement, revenue, audience growth, conversion performance, retention, traffic sources, and other relevant insights to better understand what drives results.
Content-specific Analytics
Advanced Analytics provides specialized dashboards for every supported content type, ensuring you always see the metrics that matter most.
- Courses — Track enrollments, lesson completion, student progress, revenue, and learner engagement.
- Subfeeds — Monitor subscriber growth, recurring revenue, retention, churn, and subscription performance.
- Posts — Measure reach, engagement, purchases, conversions, traffic sources, and overall post performance.
- Livestreams — Analyze watch time, viewer retention, purchases, chat activity, and post-stream performance.
- Groups — Review member growth, engagement, activity, retention, and overall community health.
Audience
The Audience section helps you understand who your customers are, how they interact with your content, and what drives them to purchase. Use these insights to identify valuable audience segments, improve retention, and make more informed decisions about your content and marketing strategy.
Audience Overview
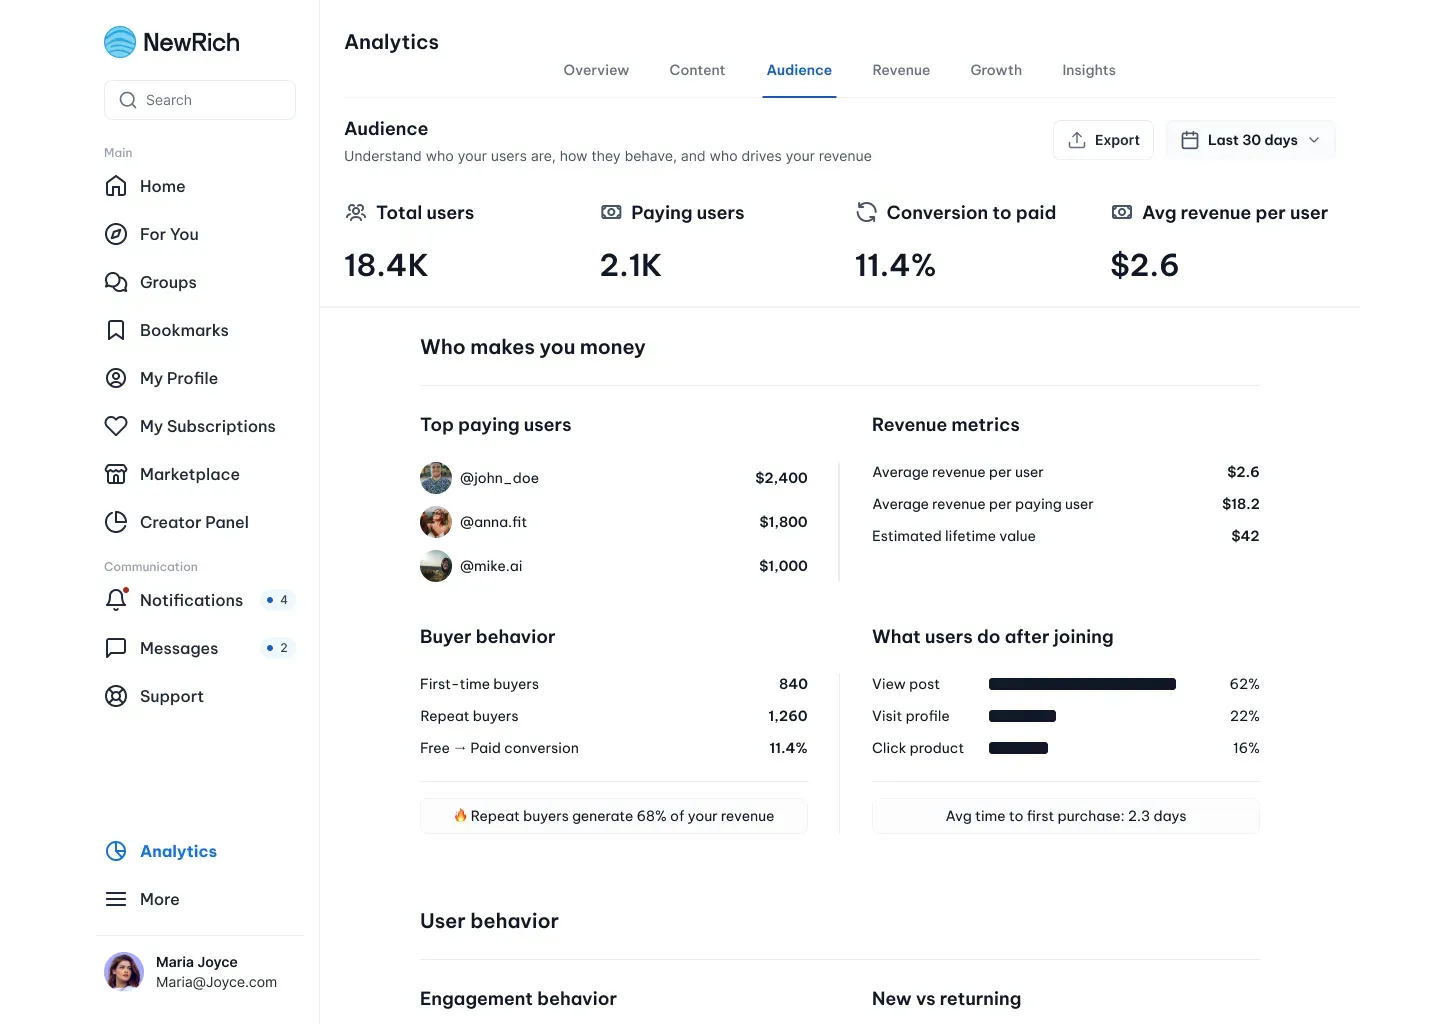
The Audience Overview dashboard provides a complete picture of your audience and customer activity.
Track important metrics such as Total Users, Paying Users, Conversion Rate, and Average Revenue per User (ARPU) while discovering where your customers come from, how they engage with your content, and which audience segments create the most value.
User Segments
Audience Analytics automatically groups your customers into meaningful segments based on their behavior and purchasing activity. These segments help you identify your most loyal supporters, high-value customers, and users who may need re-engagement by providing insights into spending, engagement, contribution to revenue, and churn risk.
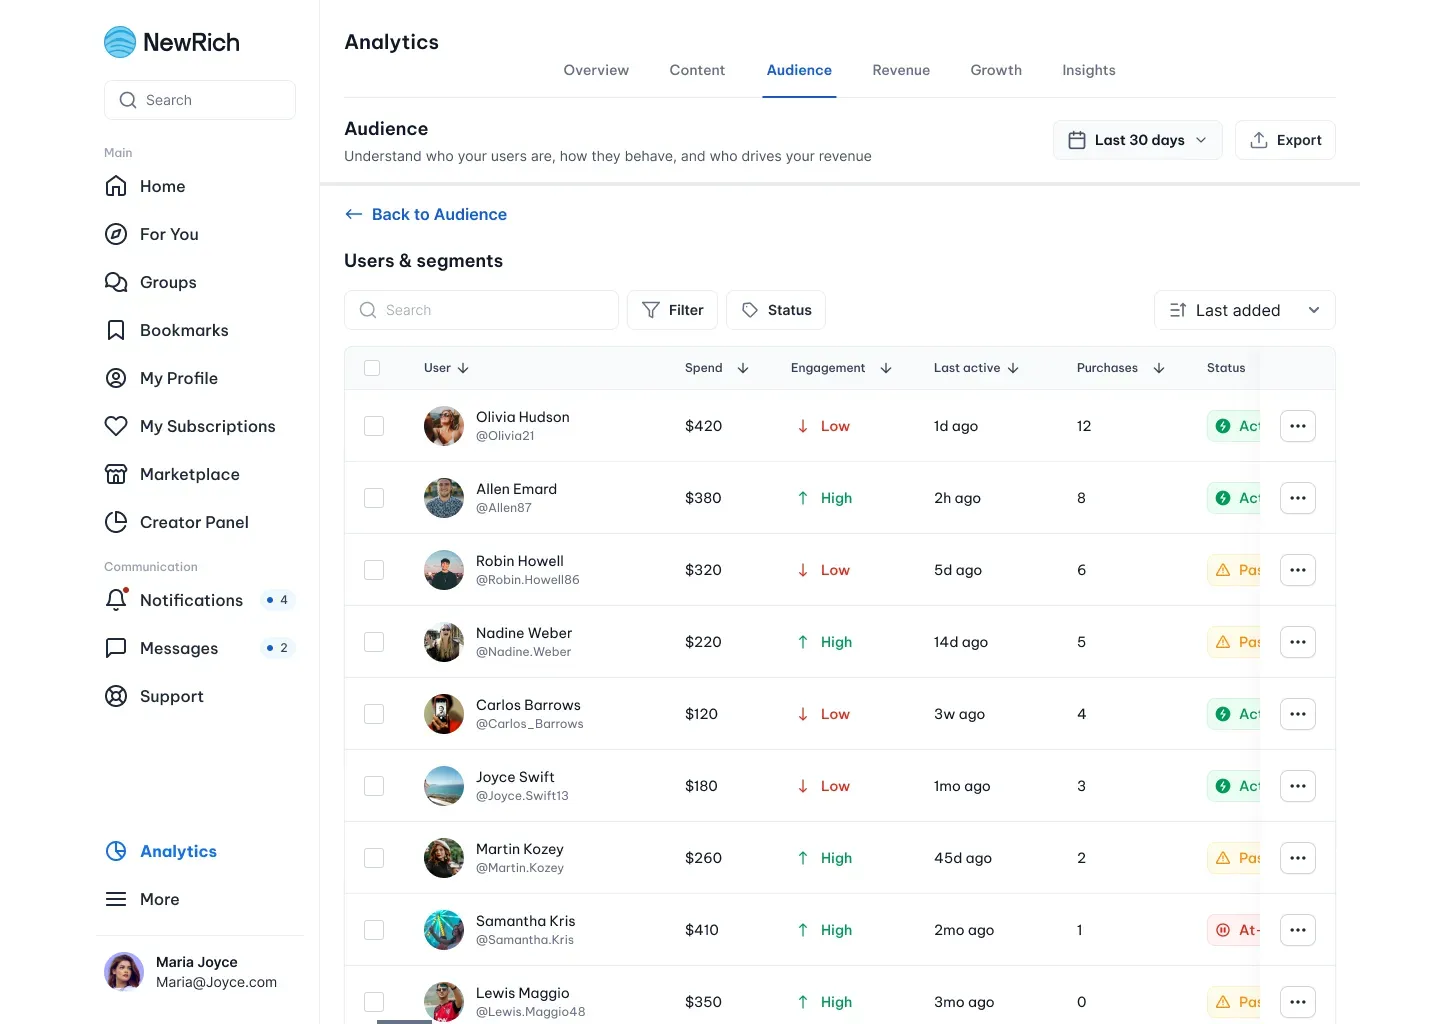
Users List
The Users section lets you explore your entire customer base in one searchable list. Filter users, compare activity and spending, review purchase history, and quickly identify your most valuable customers before opening detailed analytics for any individual user.
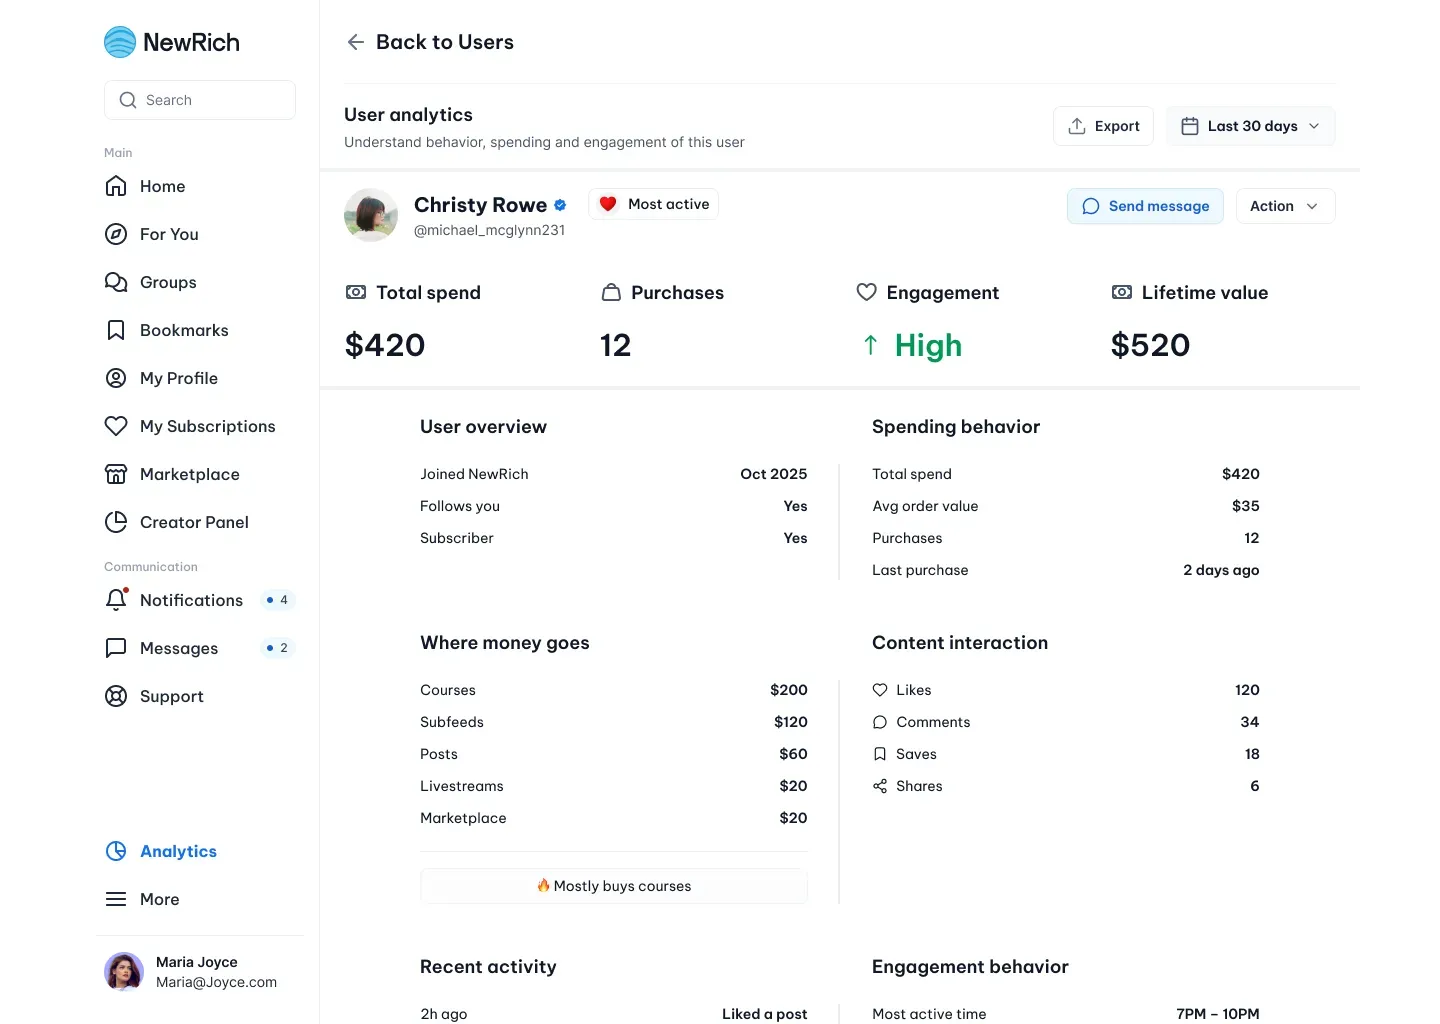
User Analytics
Opening a user provides a complete view of their relationship with your content and products. Review purchase history, lifetime value, engagement, activity, and conversion behavior to better understand each customer and identify opportunities to improve retention.
- Order Details - Every purchase can be opened to view a complete transaction summary. Review customer information, purchased products, payment details, refunds, invoices, and the full order timeline without leaving Analytics
Revenue
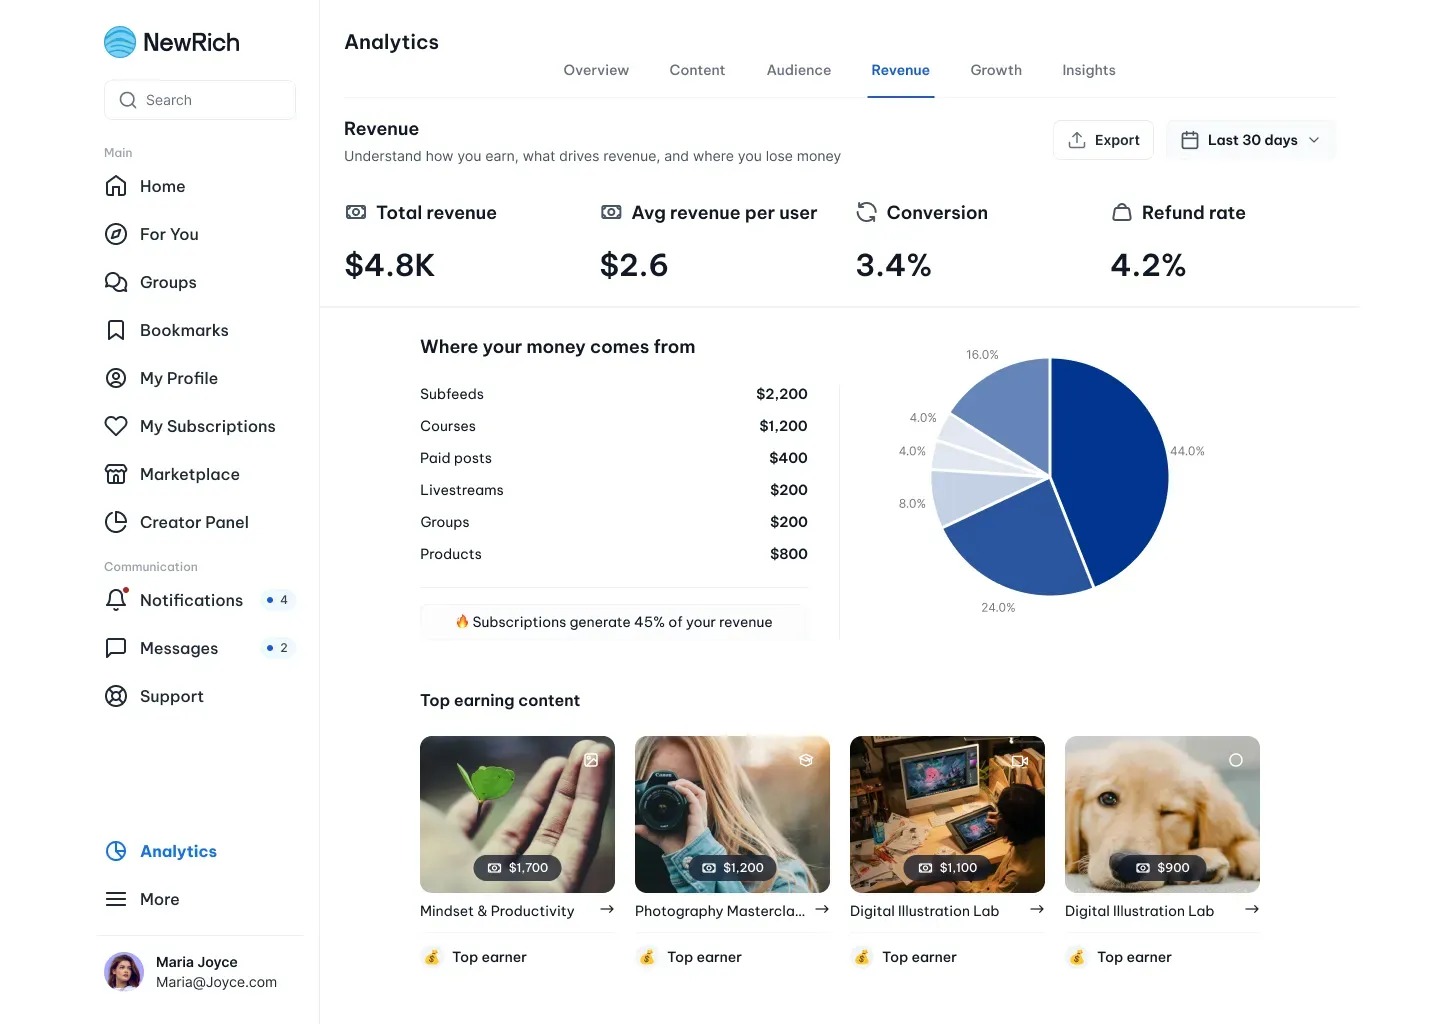
The Revenue section helps you understand where your earnings come from and which products generate the best results.
Track revenue trends, compare different income sources, monitor refunds, and identify opportunities to improve pricing and maximize revenue.
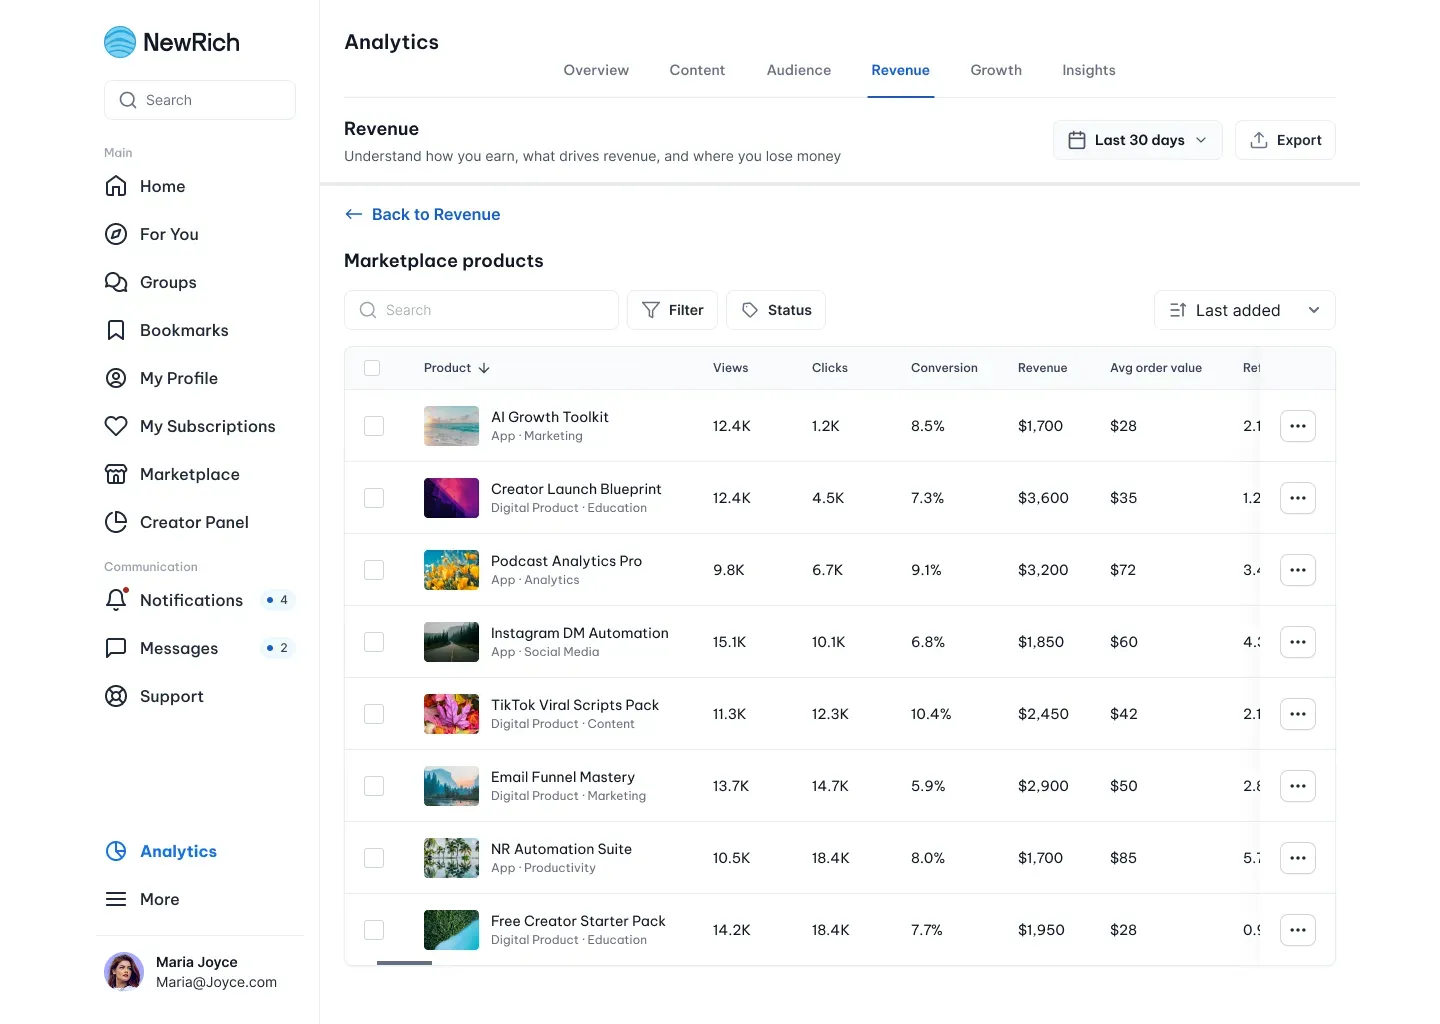
Marketplace Products
Compare the performance of all your marketplace products in one place.
Track views, conversions, revenue, average order value, and refund rates to identify your best sellers and understand which products generate the greatest return.
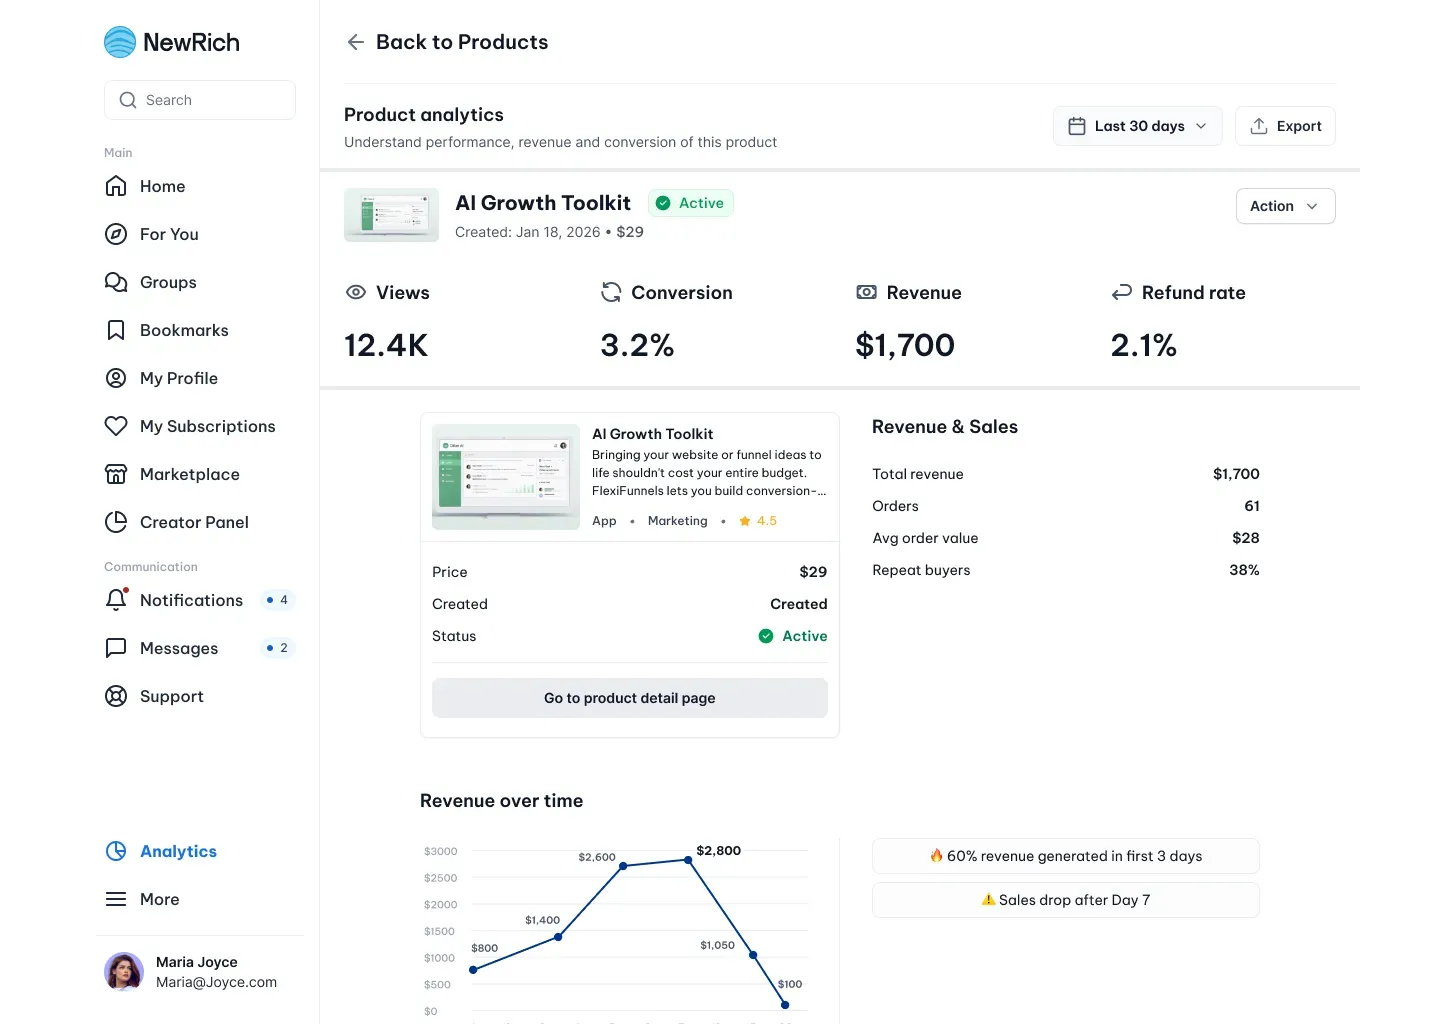
Product Analytics
Every product includes a dedicated analytics page that helps you understand how it performs over time.
Track key metrics such as revenue, sales, conversions, traffic sources, pricing performance, purchasing trends, and refunds to identify what's working and discover opportunities to improve your results.
This page gives you everything you need to optimize your product and make data-driven decisions.
Growth
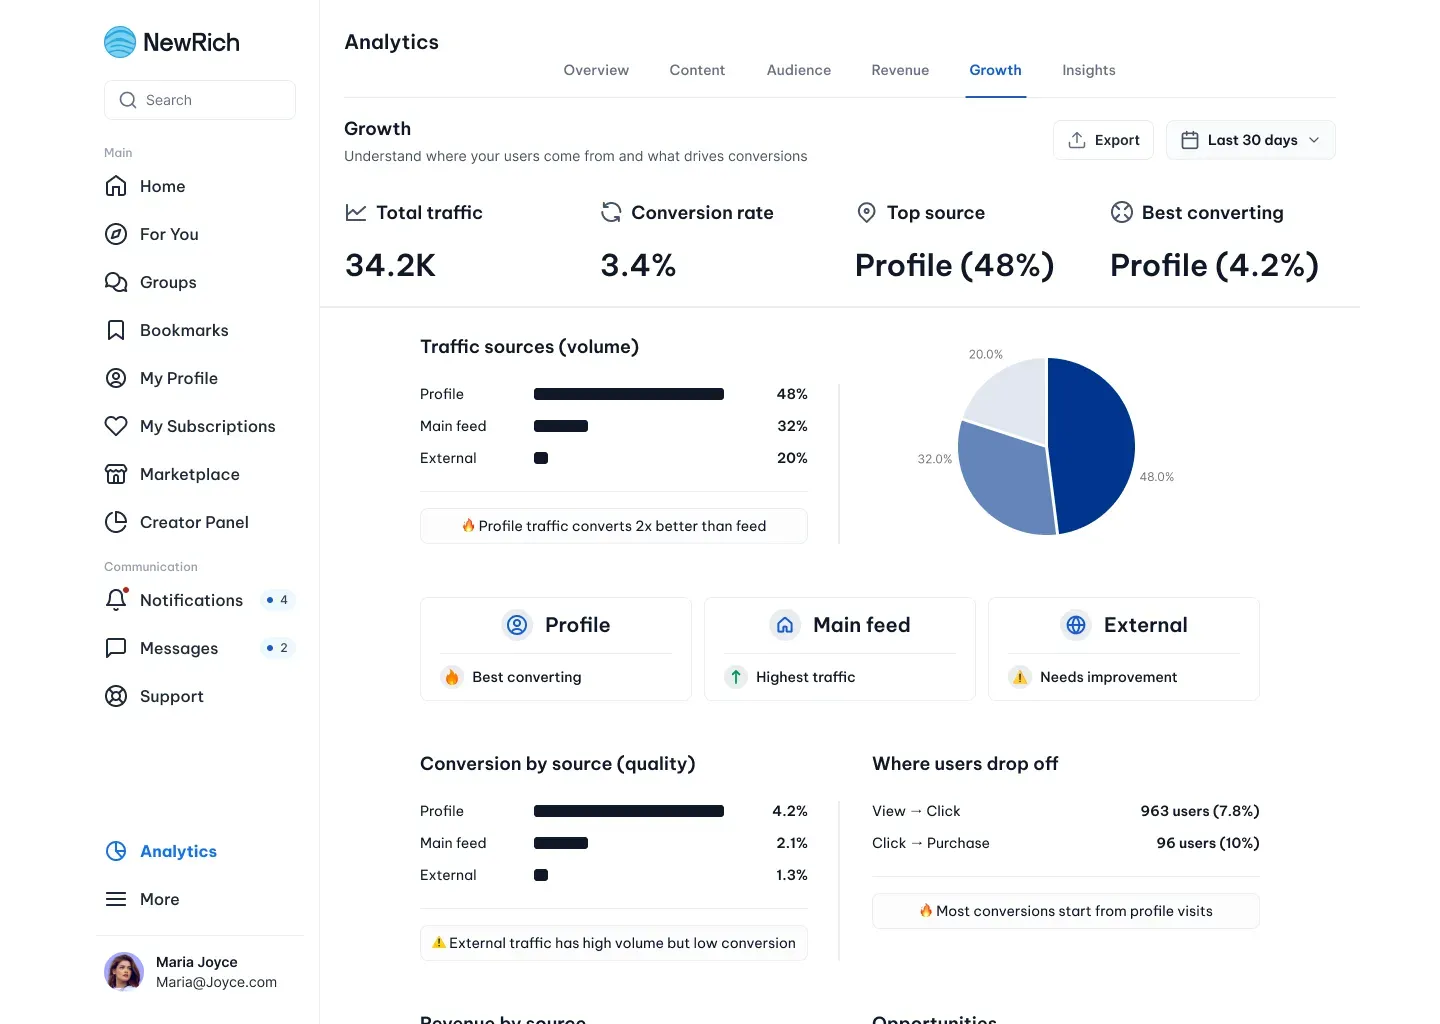
The Growth section helps you understand how people discover your content and where your best opportunities for growth come from.
Track your acquisition performance, compare traffic sources, analyze conversion rates, identify where users drop off, and see which channels generate the most revenue. Built-in insights also highlight trends and recommend actions to help you improve reach, increase conversions, and grow your audience more effectively.
The Growth dashboard includes:
- Traffic sources
- Conversion performance
- User drop-off analysis
- Revenue by acquisition source
- Growth opportunities and recommendations
Insights
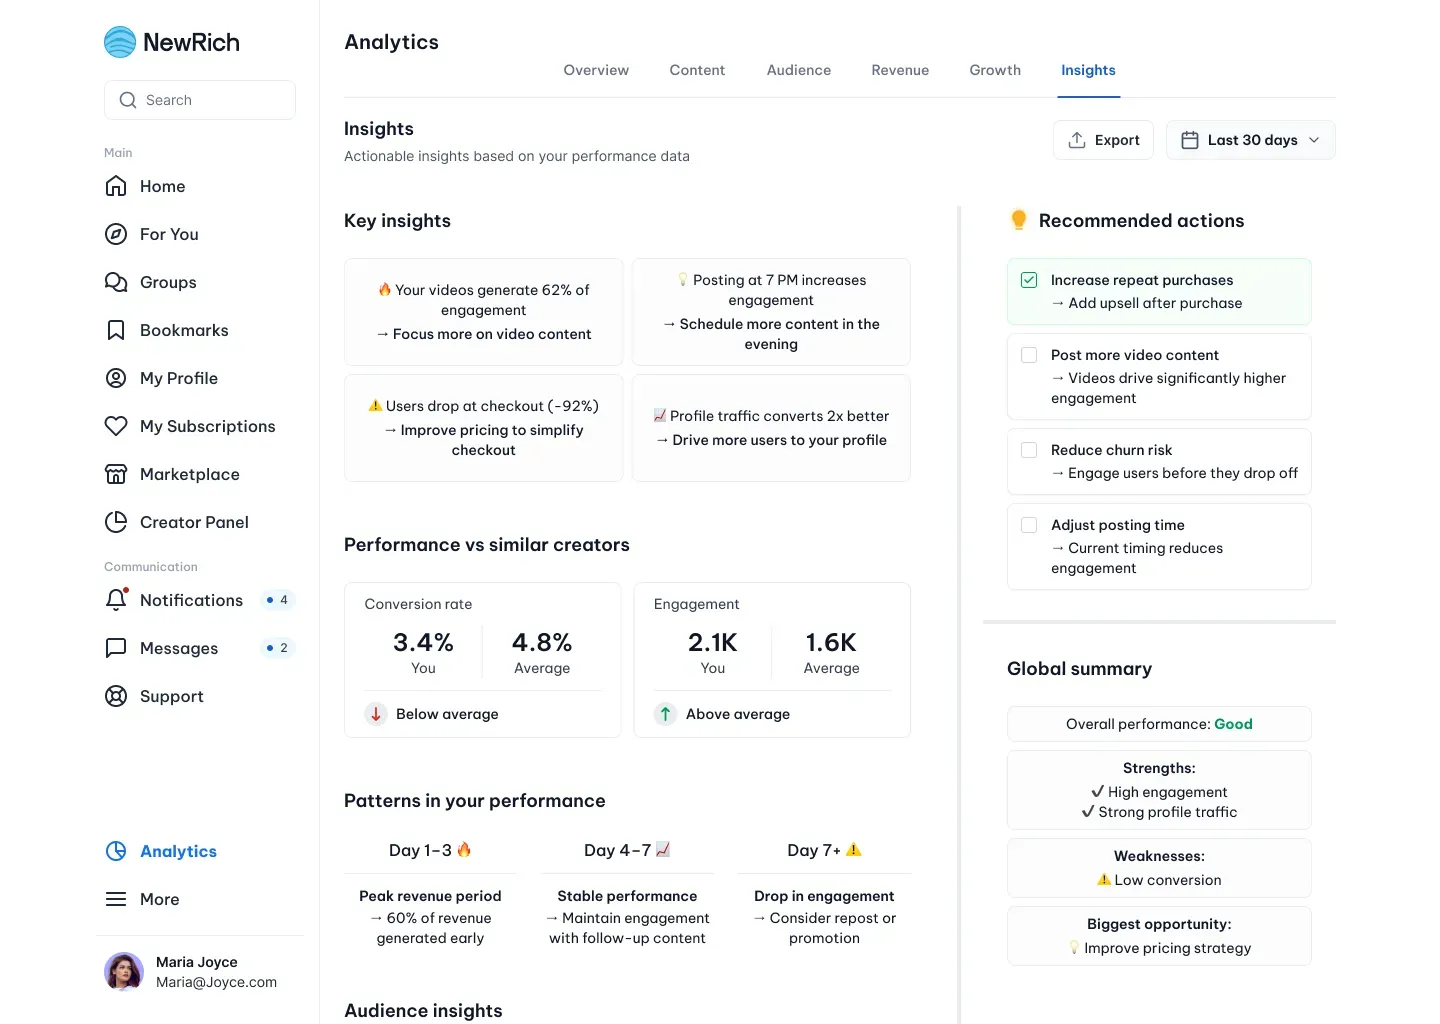
The Insights section brings together the most important findings from your analytics to help you understand what's working and where you can improve.
Discover key performance trends, compare your results over time and against similar creators, explore audience behavior, and receive personalized recommendations based on your data.
The Insights dashboard includes:
- Key performance highlights
- Personalized recommendations
- Performance comparisons
- Performance trends and patterns
- Audience insights
- Overall account summary